A bird census is a systematic effort to count and record birds in a defined area over a defined period of time, with the goal of estimating how many birds are present, which species are there, and how those numbers change over time. Think of it as taking a structured snapshot of bird life in a place, repeatable enough that you can compare one snapshot to the next and actually learn something meaningful.
Bird Census Meaning: Definition, Methods, and How to Do It

Marcus Holloway
3 Jul 2026
What 'bird census' actually means

The word 'census' carries a precise implication: you're not just watching birds casually, you're attempting a systematic count under standardized conditions so the numbers mean something. In ornithology and conservation, a bird census refers to any organized survey that tries to estimate bird abundance (how many), species richness (which ones), or both, across a specific location and timeframe.
The purpose matters as much as the process. Bird censuses are conducted to monitor population trends (are species declining or recovering?), guide conservation decisions (which habitats need protection?), track migration and breeding patterns, and measure the health of ecosystems more broadly. Birds are often used as ecological indicators precisely because they respond quickly and visibly to environmental change, so a well-run census can reveal a lot about what's happening on the ground.
It's also worth noting that 'bird census' appears in a broader cultural and linguistic context on a site like this one. The idea of 'counting birds' shows up in folklore, superstition, and even idiom (the phrase 'don't count your chickens' being the most obvious cousin). But when the term is used in a practical or scientific context, it carries a specific technical meaning that's worth understanding clearly before diving into the cultural layers.
How bird censuses are done in the field
There are several main methods, and choosing the right one depends on your goals, your terrain, and how much time you have. Here are the core approaches used by both professional researchers and citizen scientists.
Point counts

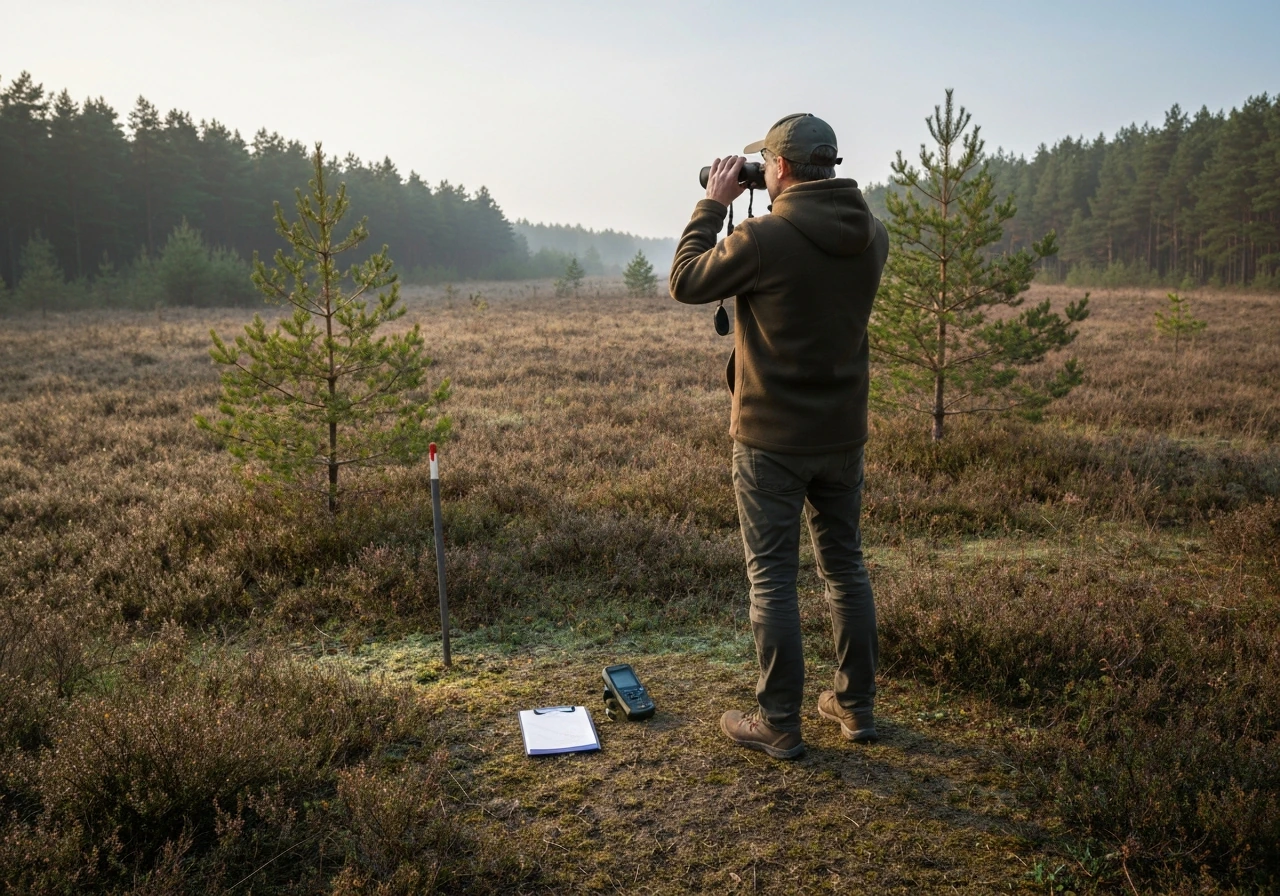
Point counts are the most widely used method in bird censusing. You stand at a fixed GPS-referenced location for a set period of time (often 3 to 5 minutes) and record every bird you see or hear within a defined radius. The North American Breeding Bird Survey (BBS), one of the largest long-term bird monitoring programs in existence, uses 50 stops per route with a 3-minute count at each stop. Observers record every bird seen within 400 meters (roughly a quarter mile) or heard from any distance during those three minutes. The fixed time and fixed radius are what make the data comparable across visits and across years.
Point counts are particularly good for evaluating changes in bird numbers over time because the effort is standardized. The Smithsonian’s monitoring manual notes that stationary point counts are best for evaluating changes in bird numbers over time, and that point counts use distance estimation and time intervals to produce abundance-related estimates [Point counts are particularly good for evaluating changes in bird numbers over time because the effort is standardized. ](https://repository. si.
edu/server/api/core/bitstreams/24ae5ec3-9e28-416b-810d-b9ba4dc28c8d/content). When the Bird Conservation Network logs point counts, each point is entered in eBird at its specific coordinates, which means data from multiple observers and multiple years can be stacked and compared meaningfully. Bird Conservation Network describes point counts as visiting fixed GPS-referenced points and using a standardized protocol so the resulting data are comparable across visits [Bird Conservation Network describes point counts as visiting fixed GPS-referenced points using a standardized protocol](https://www. bcnbirds.
org/monitoring/protocol/). Distance estimation (how far away was that bird? ) is often recorded too, which allows for more sophisticated abundance estimates later.
Transect surveys (line transects)
Instead of standing still, a transect survey involves walking a predetermined route at a steady pace and recording all birds detected within a set distance on either side of the line. Line transects are useful in habitats where you need to cover more ground, and they're common in grassland and forest monitoring. The key is walking the same route each time at a consistent pace, so effort is comparable between visits.
Area searches
An area search covers an entire defined patch (a woodland, a wetland, a field) within a set time window. A bird colony definition describes how scientists define and categorize a cluster of breeding birds for study. You move through the area systematically, trying to detect every bird present. Area searches are less mathematically precise than point counts or transects because effort varies with terrain and observer movement, but they're useful for getting a species list for a specific patch and are often used in breeding bird atlases.
Other methods worth knowing
- Territory mapping: repeated visits to plot where individual birds are singing or displaying, used to estimate breeding pairs
- Roost counts: counting birds at communal roost sites at dawn or dusk, especially useful for waterbirds and starlings
- Nest monitoring: systematic recording of active nests to estimate breeding success rather than just abundance
- Acoustic monitoring: using automated recorders to capture bird calls, increasingly common as the technology improves
What the data actually tells you

Raw counts from a bird census translate into several types of useful information, depending on how the data is analyzed.
- Population estimates: how many individuals of a species are likely present in an area, extrapolated from count data using detection models
- Species presence and absence: which species use a habitat and which don't, useful for habitat assessment and conservation planning
- Distribution patterns: where within a landscape birds are concentrated, which can guide where to focus protection efforts
- Population trends: whether numbers are going up, down, or staying stable over multiple years of repeated surveys
- Habitat associations: which species are linked to which vegetation types or land uses, informing habitat management decisions
- Phenology data: when species arrive, peak, and depart, giving insight into migration timing and breeding seasons
The BBS dataset, which runs from 1966 to the present, is one of the clearest examples of what long-term census data can reveal. Decades of standardized point counts have documented dramatic declines in grassland birds across North America, shifts in range boundaries linked to climate change, and recoveries of species following targeted conservation. None of that would be visible without the consistent, repeatable protocol underpinning the data.
Who uses bird censuses
Bird census data is genuinely useful across a wide range of people and institutions, which is part of why citizen science contributions matter so much in this field.
| Who | How they use census data |
|---|---|
| Ornithological researchers | Studying population dynamics, habitat use, and species ecology |
| Conservation organizations | Identifying declining species and prioritizing protection efforts |
| Government wildlife agencies | Setting hunting regulations, designating protected areas, tracking species of concern |
| Land managers | Assessing how management actions affect bird communities |
| Citizen scientists / birders | Contributing to large-scale datasets via programs like eBird, Christmas Bird Count, and BBS |
| Environmental consultants | Baseline surveys for development impact assessments |
| Educators and students | Teaching field methods and ecological monitoring |
Citizen science has become central to bird censusing in a way that few other fields can match. Programs like the Christmas Bird Count (running since 1900) and eBird (now holding billions of records globally) rely entirely on volunteer observers following standardized protocols. The data they generate is peer-reviewed and published in major journals. If you're a birder with good field skills, you're already a potential contributor to serious ornithological research.
Bird census vs. bird count, bird survey, and bird monitoring: clearing up the confusion
These terms are often used interchangeably in conversation, but they carry slightly different implications that are worth understanding if you're planning fieldwork or reading scientific literature. Understanding bird classes meaning can help you interpret what you record during a census.
| Term | What it usually means | Key distinction |
|---|---|---|
| Bird census | A systematic attempt to count all or most birds in an area, aiming for completeness | Implies comprehensive coverage and standardized effort |
| Bird count | Any organized tally of birds, often informal or event-based (e.g., Christmas Bird Count) | Broader and more casual; may or may not use strict protocols |
| Bird survey | A structured field effort to detect and record birds, often targeting specific species or habitats | More method-flexible; surveys can be qualitative or quantitative |
| Bird monitoring | Repeated surveys over time to track changes in populations or communities | Emphasizes the long-term, trend-detecting dimension rather than a single snapshot |
In practice, a 'bird census' is a type of survey, and a monitoring program is made up of repeated censuses or surveys. Bird culling meaning is different from bird censusing, which focuses on surveying and tracking bird populations rather than removing birds. The BBS is technically a monitoring program that uses point count surveys as its census method. The overlap is real, and you'll see all four terms used loosely in the field. The important thing is understanding what standardization and repeatability are in place, because those determine whether the data is actually useful for trend analysis.
This disambiguation also connects to related topics on this site: understanding bird activity patterns, for instance, is closely tied to when and how you conduct a census, while the concept of a bird colony introduces a different layer of population structure that census methods need to account for differently than solitary species. Understanding bird activity meaning can help you interpret what your counts suggest about timing and behavior.
How to plan your own bird census
If you want to run a bird census yourself, whether for a backyard, a local park, or a larger site, the process is straightforward once you commit to standardizing your effort. Here's how to set one up that actually produces usable data.
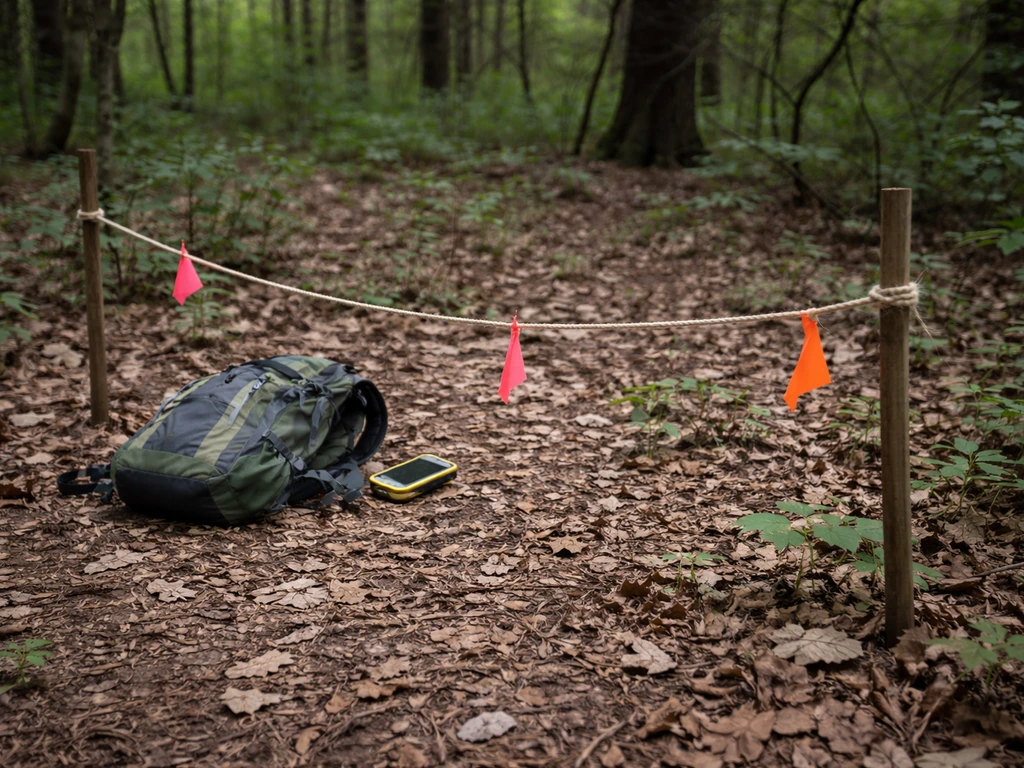
- Choose your location and define your boundaries: Pick a specific, mappable area. Mark the corners or route on a map or GPS app. Consistency here is everything: you need to survey the exact same area each time.
- Decide on your method: For most small sites, a point count or area search works well. For linear habitats like hedgerows or trails, a transect is more practical. If you're unsure, point counts are the most broadly applicable.
- Set your season and timing: Most censuses target the breeding season (roughly May through July in the Northern Hemisphere) when birds are most detectable and territorial. Surveys done 1 to 2 hours after sunrise capture peak singing activity. Avoid surveying in rain, high wind, or extreme heat.
- Standardize your effort: Fix your count duration (5 minutes per point is common), your radius (100 to 200 meters is manageable for most observers), and the number of visits. Three visits per season gives a much more reliable picture than one.
- Record standardized fields: Date, start time, weather conditions, observer name, species, count, behavior (singing, flying, foraging), and estimated distance from you. eBird's checklist format covers most of this automatically.
- Use eBird or a similar platform: Entering your data in eBird links it to a global dataset, makes it accessible to researchers, and gives you automatic trend comparisons for your location.
- Repeat the survey in subsequent years: A single census gives you a snapshot. Two or three years of data starts showing you trends. Five or more years gives you something genuinely scientifically valuable.
Interpreting your results carefully
One of the most important things to understand about bird census data is that what you counted is not the same as what was actually there. Every count is an undercount. Birds are missed because they're silent, hidden, or moving. The gap between observed count and true abundance is called detectability, and it varies by species, habitat, season, time of day, and observer skill.
This doesn't mean your data is useless. It means you need to interpret counts as indices of abundance rather than absolute totals. If you counted 12 Song Sparrows this May and 8 last May using the same protocol on the same route, that relative decline is meaningful even if the true number was 20 and 15. The standardized effort is what makes comparison valid.
Here are the main sources of bias and limitation to keep in mind:
- Observer variation: Different people have different ear and eye skills. Ideally, the same observer does all repeat surveys at a given site. If observers change, note it in your records.
- Weather and time of day: Birds sing less in wind, rain, and heat. Surveys done at different times of day or in different weather conditions aren't directly comparable.
- Seasonal timing: Surveying two weeks earlier or later than last year can make populations look different when they've just shifted their timing. Try to match survey dates within the same two-week window each year.
- Habitat change: If vegetation grows up around a survey point, detectability drops even if bird numbers are stable. Note any major habitat changes.
- Species-specific detectability: Loud, conspicuous species like woodpeckers are reliably detected; quiet, cryptic species like rails are consistently undercounted. Distance sampling methods can help correct for this statistically.
The bottom line on interpretation: treat your first census as a baseline, not a verdict. The value compounds with each repeat visit. Over time, even a modest, carefully standardized census run by a single dedicated birder can produce data that genuinely informs local conservation decisions. That's not a small thing.
FAQ
If counts are always an undercount, how can I compare results across months or years?
Because every visit misses some birds, your “census” number is best treated as an index, not the true population size. To reduce error, keep the same start time window, duration, and radius (or transect width), and record weather and wind, since detectability drops noticeably when visibility and audibility decline.
Which bird census method should I pick if I want the most reliable results for my specific habitat?
Choose a protocol that matches your detection strengths and the birds you expect. Point counts work well for species that vocalize or perch consistently near survey points, while transects can better capture birds that occur along edges or through open habitat. If the goal is a complete species list for a patch, area searches can be more practical, but plan more consistent movement rules to limit variation.
What does “standardized conditions” mean in real fieldwork, beyond marking a GPS spot?
Standardization is not just about where you stand, it’s also about what “the same effort” means. Use the same route geometry (for transects), the same radius boundaries (for points), a steady walking pace (for transects), and the same area coverage pattern (for areas). If terrain forces a detour, note it and document what changed, so you can judge whether comparisons are valid.
Can I combine data from different observers or different years into one trend chart?
Yes, but only when you manage detectability differences carefully. Use the same protocol and try to keep observer identity consistent (same person, same experience level). If multiple observers are involved, use a consistent scoring approach like whether you count “heard” birds the same way each time, and consider running a few overlapping sessions early to calibrate expectations.
I only have one afternoon, what’s the best way to run my first bird census so it’s still usable later?
If you’re unsure, start with point counts for abundance trends, because they naturally support repeatable comparisons when you keep the radius and time fixed. Use distance notes if possible (estimate how far birds were) to improve future analyses. For a first baseline, don’t expand to multiple methods at once, because mixing protocols can make trends hard to interpret.
How should I handle migration versus breeding when interpreting census results?
Season changes what’s “countable” and how birds behave, so you should avoid mixing seasons when you’re trying to measure trends for a particular population. A practical approach is to define a repeatable window (for example, the same week range each year or the same early breeding window) and keep it consistent, then treat migration influx separately as its own condition.
If my species list grows, does that automatically mean the bird population increased?
A common mistake is assuming that more species equals “more birds.” Species richness can rise even when abundance is stable, because short-term visitors inflate lists. To avoid over-interpreting, analyze richness and abundance indices separately, and if possible record effort consistently so changes in detection do not masquerade as ecological change.
How big of a change in counts is meaningful, given detectability and undercounting?
Yes, if you interpret them correctly. If your protocol produced consistent relative counts, a change can indicate a trend even though absolute numbers are unknown. When the shift is small, it may fall within detection noise, so repeat at least several times across comparable dates and weather conditions before concluding the population truly changed.
What should I do with birds I see outside my census window or route?
Incidental records usually aren’t the same as census data unless they follow the same standardized rules. For example, opportunistic sightings during walks differ in effort and coverage. If you want them, log them separately from your census dataset so you can report them as supplementary observations, not trend evidence.
How can I scale a backyard or local park census so my data is useful for broader monitoring?
Many monitoring programs include a larger sampling design, but you can still contribute locally. Focus on consistency first, then scale up by adding more points on the same schedule rather than running longer counts at a few points. Document your site boundaries clearly and keep the same number of visits per season, so your data is comparable over time.
Next Article
Bird Activity Meaning: What You See, Hear, or Dream
Learn bird activity meaning: what flocking, singing, nesting, and window visits signal, plus dream and idiom interpretat